
The Dashboard is your central hub for at-a-glance insights into your WhatsApp communication performance. Here's a breakdown of each section.
1. Date Range Filter Located at the top right, this filter allows you to change the time period for all the stats and charts on the dashboard. You can view data for the last 7, 30, or 90 days.
2. Key Performance Indicators (KPIs) These four cards at the top give you a high-level summary of your performance over the selected date range.
Messages Sent: Total number of outgoing messages (from campaigns and individual chats) that were successfully sent.
Delivery Rate: The percentage of sent messages that were successfully delivered to the recipient's device.
Open Rate: (Also known as Read Rate) The percentage of delivered messages that were read by the recipient.
Click-Through Rate (CTR): [This is a conceptual metric for future implementation] The percentage of users who clicked a link in your messages.
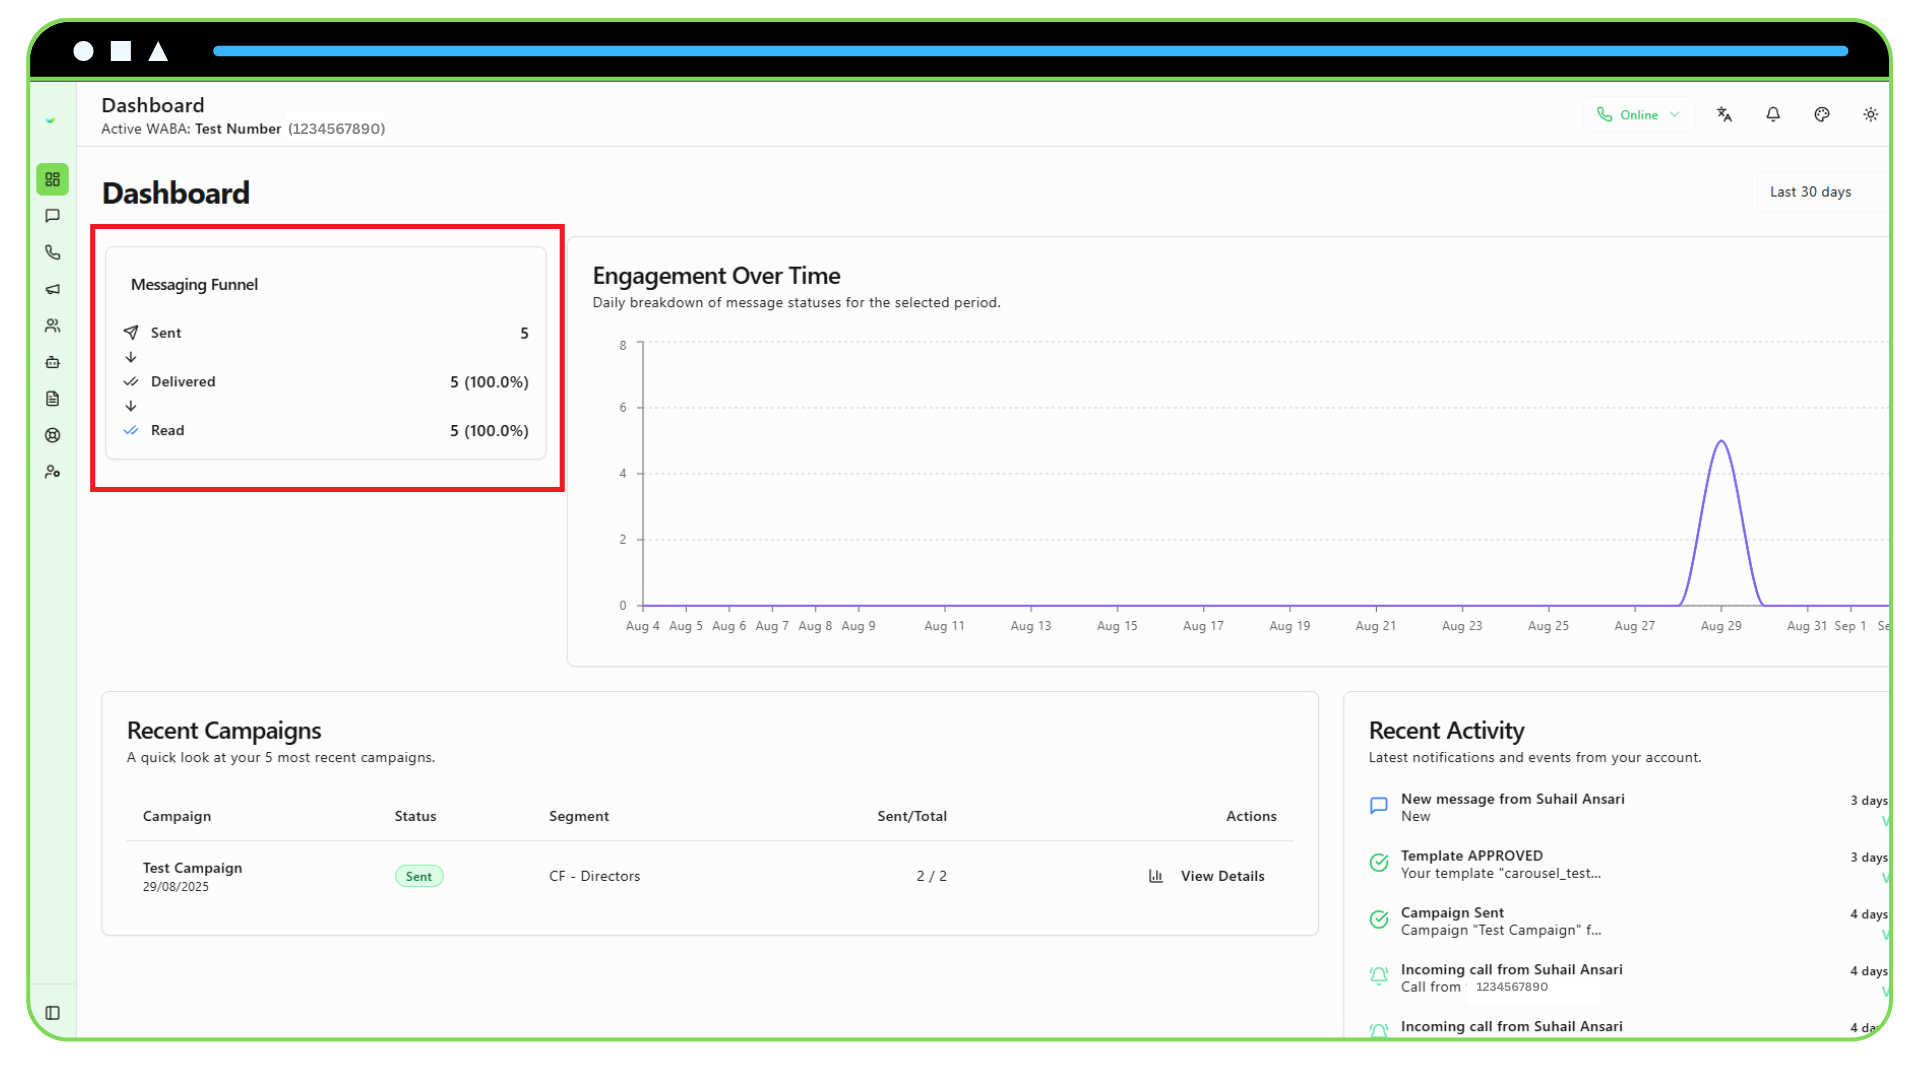
3. Messaging Funnel This card provides a visual breakdown of your message delivery funnel, showing the drop-off from Sent to Delivered to Read. It's a quick way to spot potential issues with deliverability or engagement.
4. Engagement Over Time Chart This line chart visualizes your messaging activity and engagement over the selected date range.
- Sent (Blue Line): Shows the volume of messages sent each day.
- Delivered (Green Line): Shows how many of those sent messages were successfully delivered.
- Read (Accent Line): Shows how many delivered messages were read by users. You can hover over any point on the chart to see the exact numbers for that day.
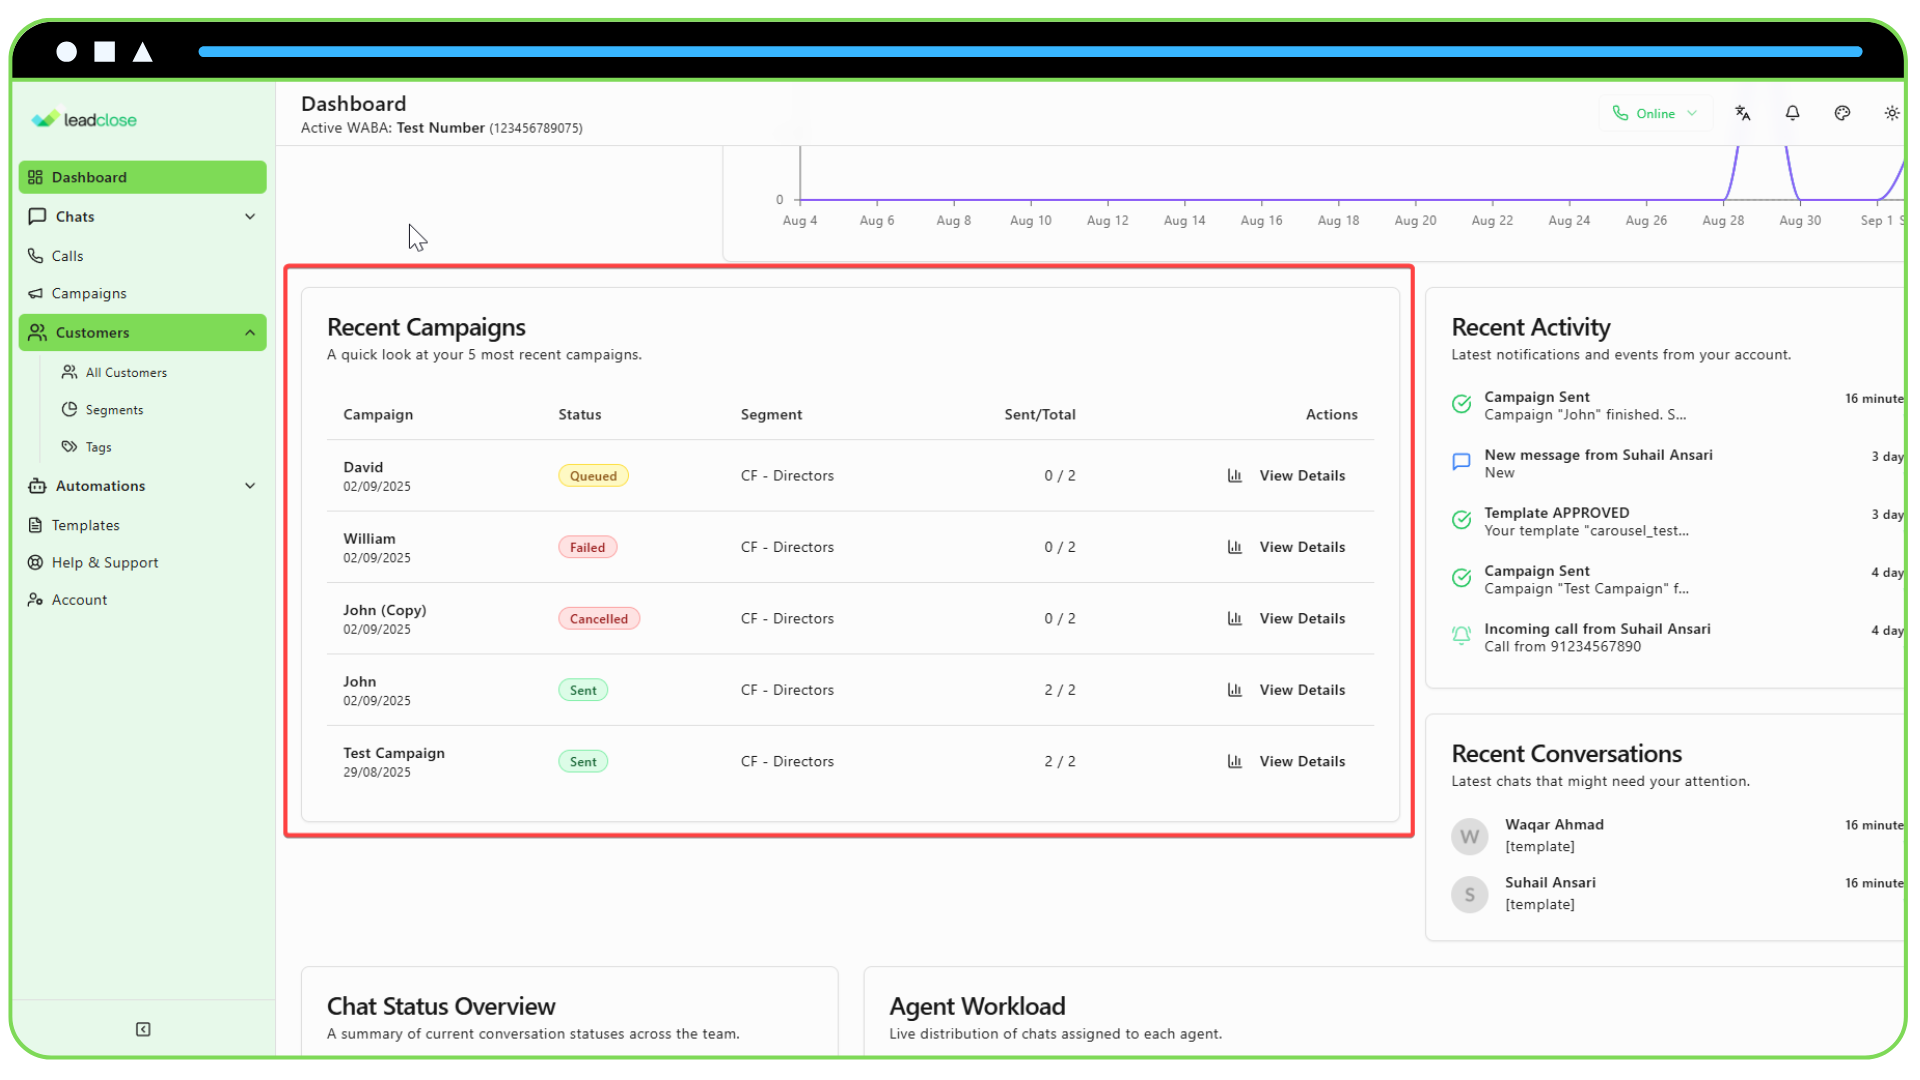
5. Recent Campaigns Table This table gives you a quick overview of your 5 most recently created campaigns. You can see the campaign name, its current status, the target segment, and its sending progress. Click "View Details" to go directly to that campaign's detailed analytics page.
6. Chat & Agent Performance
- Chat Status Overview: A pie chart showing the current distribution of your conversations (Unassigned, Open, Pending, Resolved).
- Agent Workload Distribution: A table that shows how many conversations are currently assigned to each of your team members, broken down by status. This helps you understand your team's workload at a glance.